A couple of days ago, I was informed about performance degradation which periodically happened in our production system of MS SQL Server 2012 instance running under Windows Server 2012R2. QUERYSTORE would be good solution for monitoring performance for the situation, however it comes in SQL Server 2014 version. Because there is not QUERYSTORE technology in SQL Server 2012, lets create manual sampling by using BRENTOZAR script sp_BlitzFirst. I have created JOB which runs every 15 minute and calls the sp_BlitzFirst. Please see below:
USE [msdb]
GO
DECLARE @jobId BINARY(16)
EXEC @ReturnCode = msdb.dbo.sp_add_job @job_name=N'DBAtools_Sampling',
@enabled=0,
@notify_level_eventlog=0,
@notify_level_email=0,
@notify_level_netsend=0,
@notify_level_page=0,
@delete_level=0,
@description=N'No description available.',
@category_name=N'[Uncategorized (Local)]',
@owner_login_name=N'SA', @job_id = @jobId OUTPUT
IF (@@ERROR <> 0 OR @ReturnCode<> 0) GOTO QuitWithRollback

EXEC @ReturnCode = msdb.dbo.sp_add_jobstep @job_id=@jobId, @step_name=N'Step1',
@step_id=1,
@cmdexec_success_code=0,
@on_success_action=1,
@on_success_step_id=0,
@on_fail_action=2,
@on_fail_step_id=0,
@retry_attempts=0,
@retry_interval=0,
@os_run_priority=0, @subsystem=N'TSQL',
@command=N'EXEC sp_BlitzFirst
@Seconds = 30,
@OutputDatabaseName = ''DBAtools'',
@OutputSchemaName = ''dbo'',
@OutputTableName = ''BlitzFirst'',
@OutputTableNameFileStats = ''BlitzFirst_FileStats'',
@OutputTableNamePerfmonStats = ''BlitzFirst_PerfmonStats'',
@OutputTableNameWaitStats = ''BlitzFirst_WaitStats'',
@OutputTableNameBlitzCache = ''BlitzCache''',
@database_name=N'DBAtools',
@flags=0
IF (@@ERROR <> 0 OR @ReturnCode <> 0) GOTO QuitWithRollback
EXEC @ReturnCode = msdb.dbo.sp_update_job @job_id = @jobId, @start_step_id = 1
IF (@@ERROR <> 0 OR @ReturnCode <> 0) GOTO QuitWithRollback
EXEC @ReturnCode = msdb.dbo.sp_add_jobschedule @job_id=@jobId, @name=N'Schedule1',
@enabled=1,
@freq_type=4,
@freq_interval=1,
@freq_subday_type=4,
@freq_subday_interval=15,
@freq_relative_interval=0,
@freq_recurrence_factor=0,
@active_start_date=20190620,
@active_end_date=99991231,
@active_start_time=0,
@active_end_time=235959,
@schedule_uid=N'1d27b7fb-ae33-4334-94f2-7b9101692760'
IF (@@ERROR <> 0 OR @ReturnCode <> 0) GOTO QuitWithRollback
EXEC @ReturnCode = msdb.dbo.sp_add_jobserver @job_id = @jobId, @server_name = N'(local)'
IF (@@ERROR <> 0 OR @ReturnCode <> 0) GOTO QuitWithRollback
COMMIT TRANSACTION
GOTO EndSave
QuitWithRollback:
IF (@@TRANCOUNT > 0) ROLLBACK TRANSACTION
EndSave:
GO
About sp_BlitzFirst you can read from BRENTOZR blog. It creates a couple of tables and views in the given database for periodically sampling (30 seconds in our situation) from SQL Server internal performance views like dm_os_wait_stats, dm_io_virtual_file_stats and etc.

After sampling we can select the blitzfirst_waitstats table and see which are the most occurred waits.
select [wait_type],
 sum([wait_time_ms]) / 1000 / 3600 wt
  from [dbatools].[dbo].[blitzfirst_waitstats] group by [wait_type]
    order by wt desc

wait_type	         wt
TRANSACTION_MUTEX	30024
BACKUPIO	        2504
TRACEWRITE	        1792
ASYNC_NETWORK_IO	1179
SOS_SCHEDULER_YIELD	906
CXPACKET	        753
LCK_M_IS	        696
LCK_M_SCH_M	        630
WRITELOG	        513
LCK_M_SCH_S	        452
LCK_M_IX	        319
...........
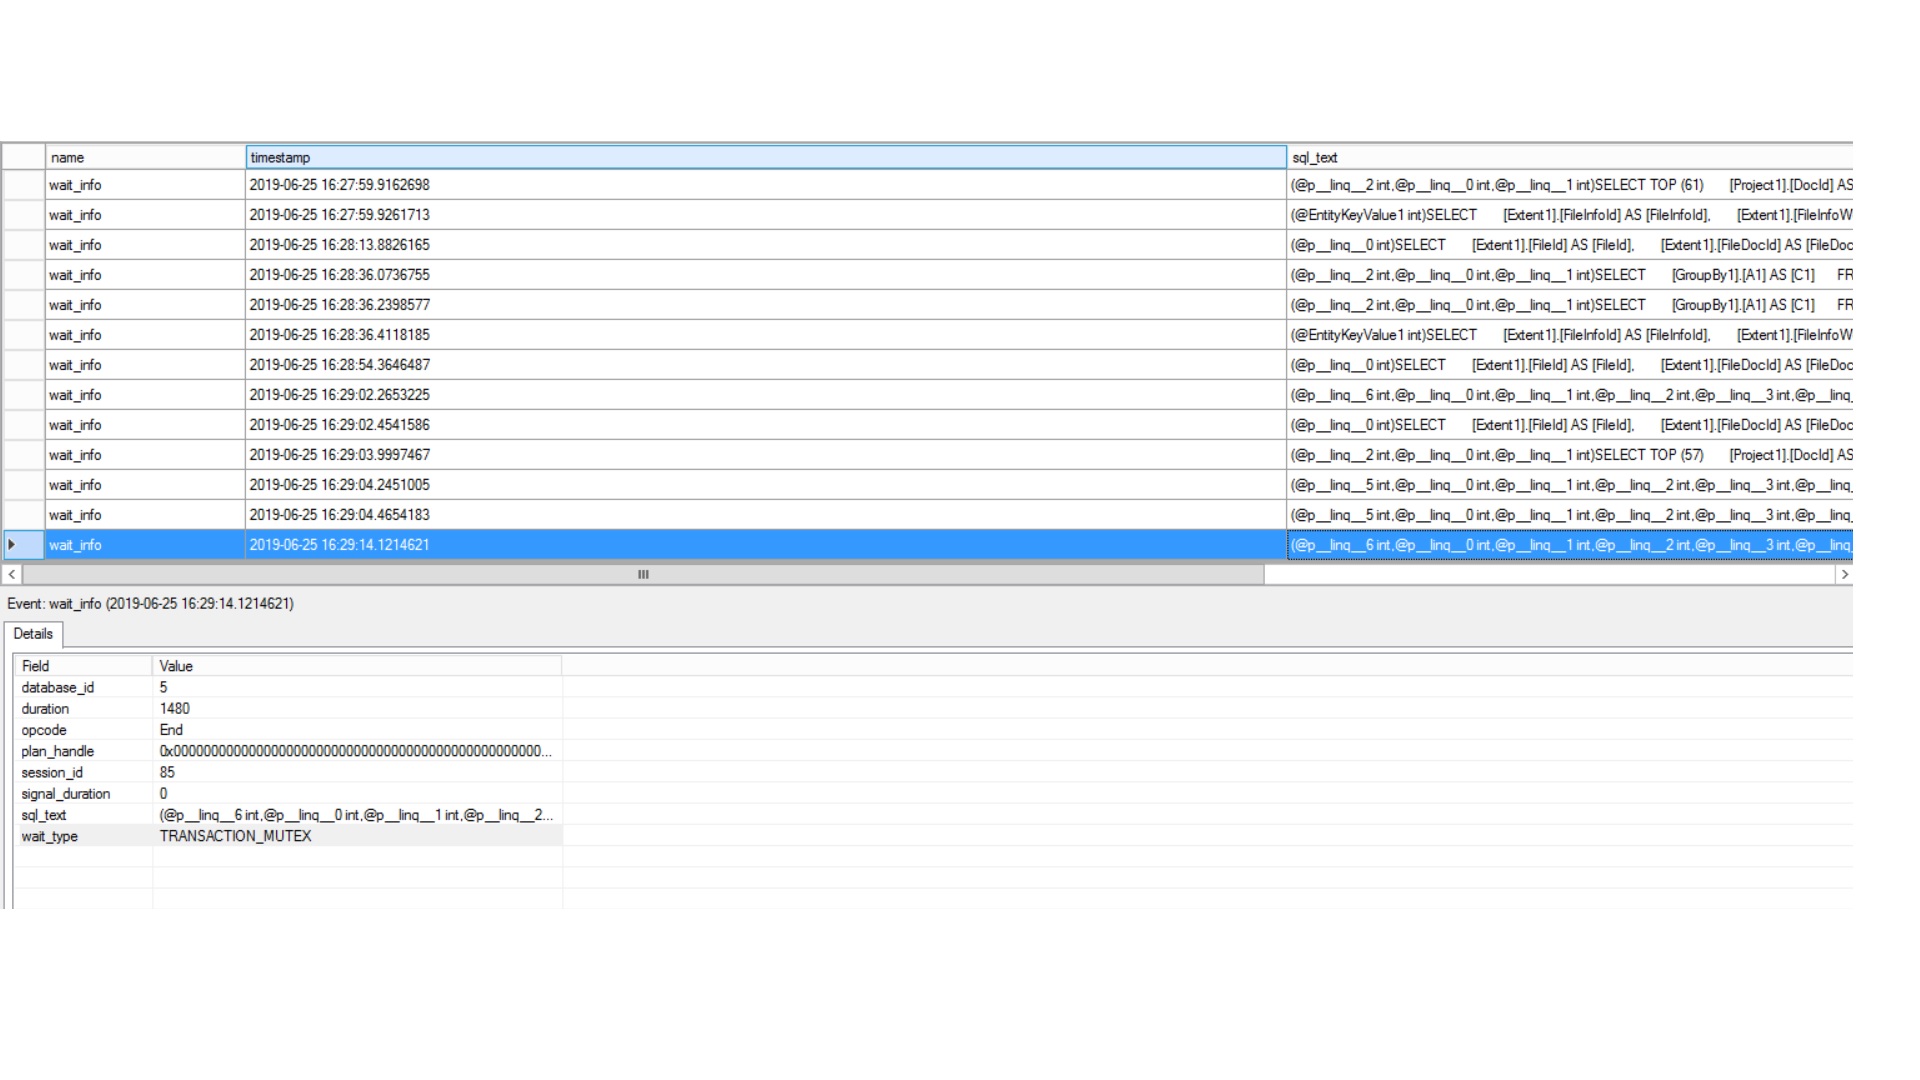
As we see the TRANSACTION_MUTEX is the top wait. The Books Online definition of TRANSACTION_MUTEX is that it “occurs during synchronization of access to a transaction by multiple batches. Lets go deeper and catch the query which generates TRANSACTION_MUTEX wait. For doing that I am going to use Extended Events technology.
First of all I got the code of TRANSACTION_MUTEX wait
SELECT
[map_key]
FROM sys.dm_xe_map_values
WHERE [name] = N'wait_types'
AND [map_value] = N'TRANSACTION_MUTEX';

map_key
---------
210
Then created Extended Event for catching Query which generate TRANSACTION_MUTEX wait.
CREATE EVENT SESSION [InvestigateWaits] ON SERVER
ADD EVENT sqlos.wait_info(
    ACTION(sqlserver.database_id,sqlserver.plan_handle,sqlserver.session_id,sqlserver.sql_text,sqlserver.tsql_stack,sqlserver.username)
    WHERE ([wait_type]=(210) AND [opcode]=(1)))
ADD TARGET package0.ring_buffer
WITH (MAX_MEMORY=51200 KB,EVENT_RETENTION_MODE=ALLOW_SINGLE_EVENT_LOSS,MAX_DISPATCH_LATENCY=5 SECONDS,MAX_EVENT_SIZE=0 KB,MEMORY_PARTITION_MODE=NONE,TRACK_CAUSALITY=OFF,STARTUP_STATE=OFF)
GO
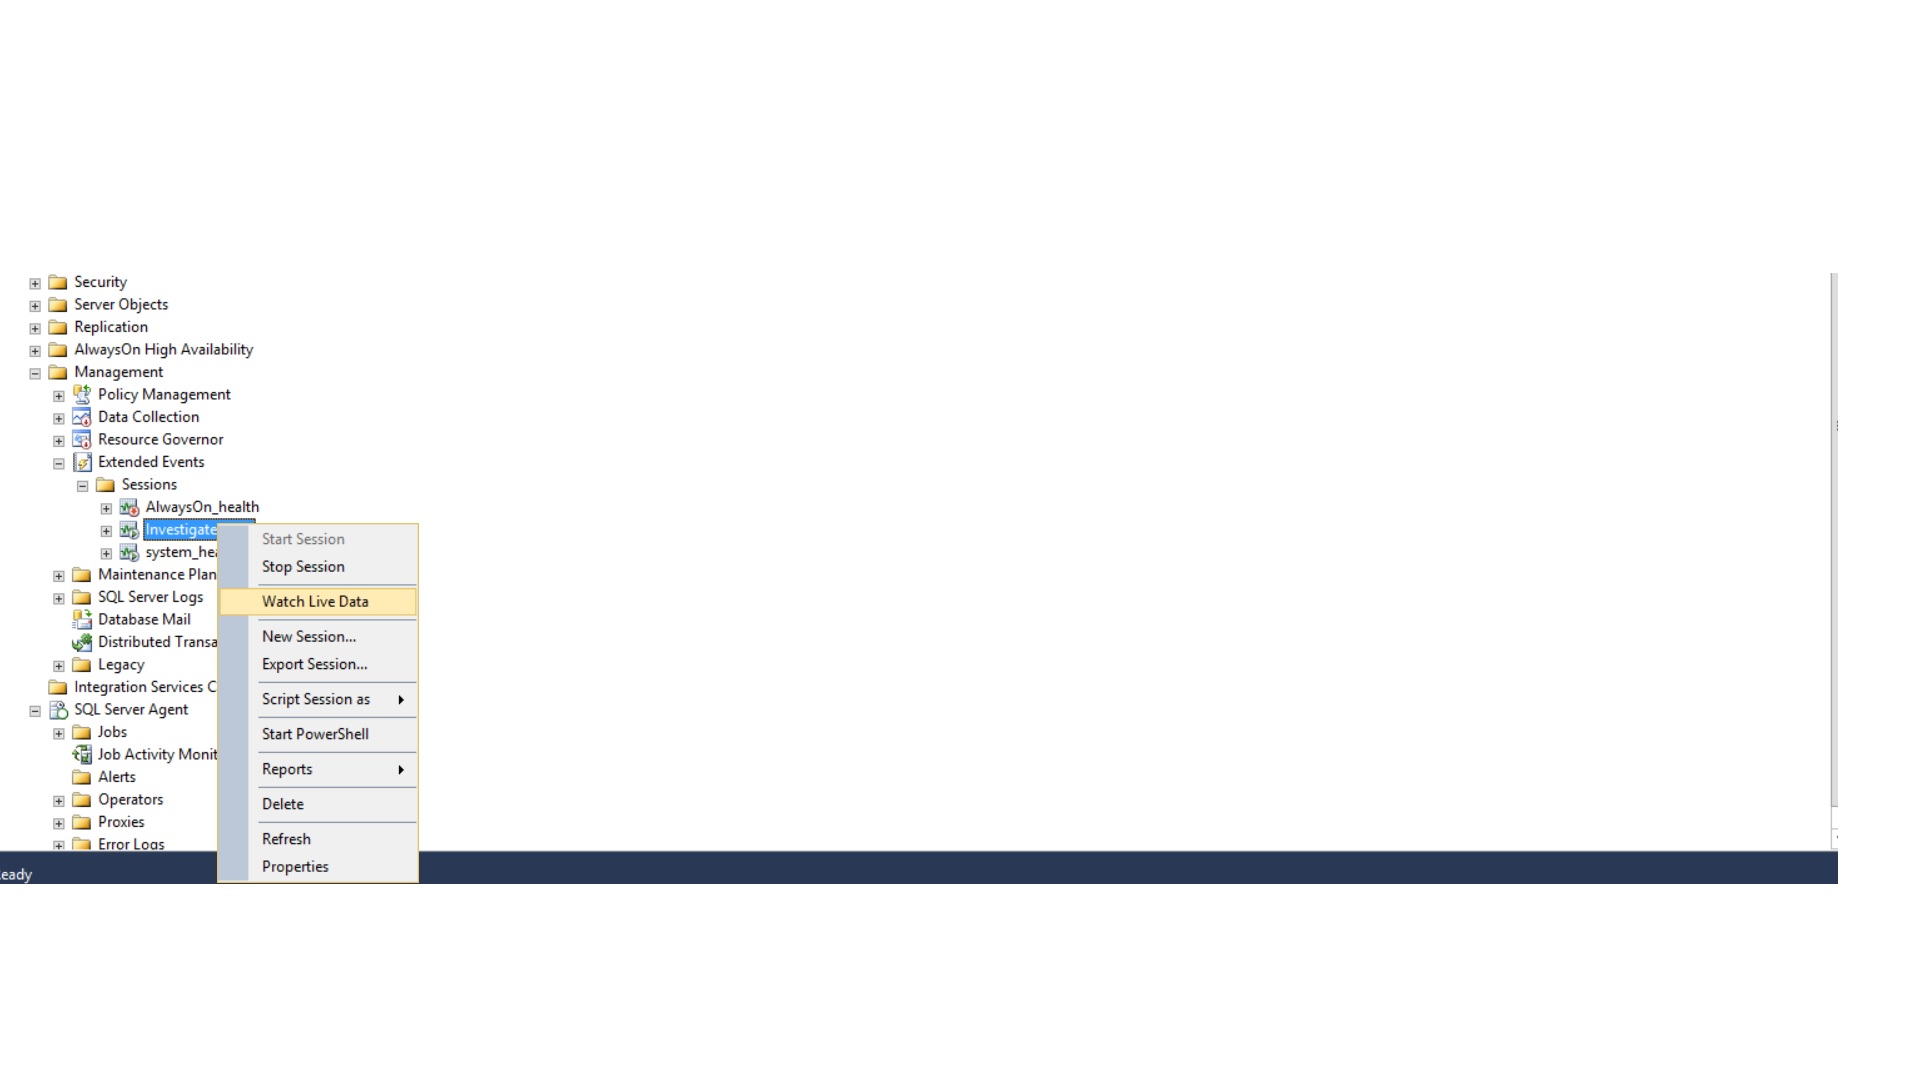
Activate created Extended Event and open Watch Live Data page.

We should see window like below.

After monitoring some period of time, At last I have got that query. The query and its plan shown below.
SELECT
    [GroupBy1].[A1] AS [C1]
    FROM ( SELECT
        COUNT(1) AS [A1]
        FROM  [dbo].[VW_DOCS] AS [Extent1]
        LEFT OUTER JOIN [dbo].[DOCS_READSTATUS] AS [Extent2] ON ([Extent1].[DocId] = [Extent2].[DocId]) AND ([Extent2].[WorkplaceId] = 24)
        WHERE ([Extent1].[DocDoctypeId] = 1) AND ([Extent1].[DocPeriodId] = 3) AND (([Extent1].[DocOrganizationId] = 24) OR ( EXISTS (SELECT
            1 AS [C1]
            FROM  [dbo].[DOCS_EXECUTOR] AS [Extent3]
            INNER JOIN [dbo].[DOCS_DIRECTIONS] AS [Extent4] ON [Extent3].[ExecutorDirectionId] = [Extent4].[DirectionId]
            WHERE ([Extent1].[DocId] = [Extent3].[ExecutorDocId]) AND ((([Extent3].[ExecutorWorkplaceId] = 24) AND (1 = [Extent4].[DirectionConfirmed])) OR (([Extent3].[ExecutorOrganizationId] = 24) AND (1 = [Extent4].[DirectionConfirmed])))
        ))) AND (( NOT ((2 =  CAST( [Extent1].[DocDeleted] AS int)) AND ([Extent1].[DocDeleted] IS NOT NULL))) OR ((2 =  CAST( [Extent1].[DocDeleted] AS int)) AND ([Extent1].[DocInsertedById] = 24))) AND (1 = 1)
    )  AS [GroupBy1]
 It is one of the most usable query and it takes about 3 seconds to complete. From the query plan we see expensive Nested Loop join which will generate concurrency in case of many query like this will be running. However, If we change join method to Hash Join by using SQL Server hint OPTION(HASH JOIN), we will decrease concurrency and query run time (less then one second). Corrected version of query and its plan shown below.
SELECT
    [GroupBy1].[A1] AS [C1]
    FROM ( SELECT
        COUNT(1) AS [A1]
        FROM  [dbo].[VW_DOCS] AS [Extent1]
        LEFT OUTER JOIN [dbo].[DOCS_READSTATUS] AS [Extent2] ON ([Extent1].[DocId] = [Extent2].[DocId]) AND ([Extent2].[WorkplaceId] = 24)
        WHERE ([Extent1].[DocDoctypeId] = 1) AND ([Extent1].[DocPeriodId] = 3) AND (([Extent1].[DocOrganizationId] = 24) OR ( EXISTS (SELECT
            1 AS [C1]
            FROM  [dbo].[DOCS_EXECUTOR] AS [Extent3]
            INNER JOIN [dbo].[DOCS_DIRECTIONS] AS [Extent4] ON [Extent3].[ExecutorDirectionId] = [Extent4].[DirectionId]
            WHERE ([Extent1].[DocId] = [Extent3].[ExecutorDocId]) AND ((([Extent3].[ExecutorWorkplaceId] = 24) AND (1 = [Extent4].[DirectionConfirmed])) OR (([Extent3].[ExecutorOrganizationId] = 24) AND (1 = [Extent4].[DirectionConfirmed])))
        ))) AND (( NOT ((2 =  CAST( [Extent1].[DocDeleted] AS int)) AND ([Extent1].[DocDeleted] IS NOT NULL))) OR ((2 =  CAST( [Extent1].[DocDeleted] AS int)) AND ([Extent1].[DocInsertedById] = 24))) AND (1 = 1)
    )  AS [GroupBy1]
	OPTION (HASH JOIN)
 Problem has been fixed. Thank you for attention 🙂
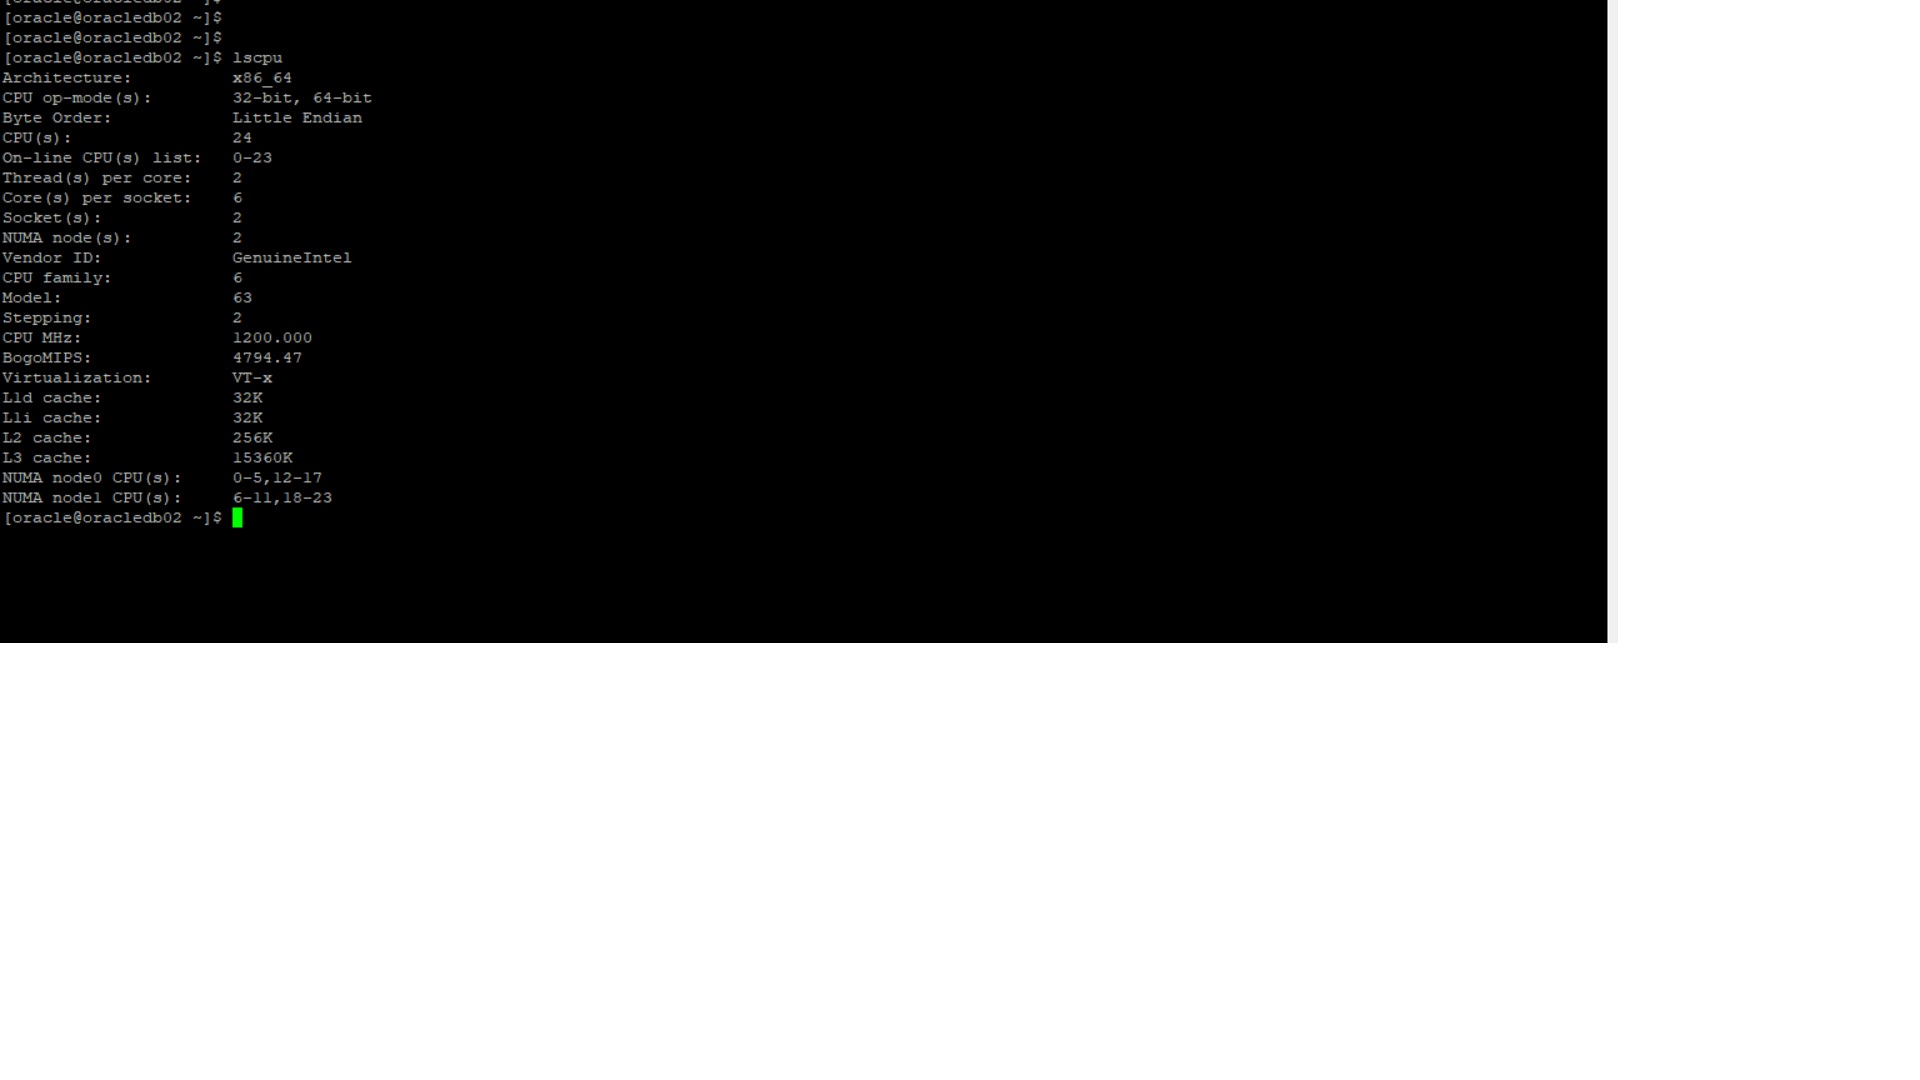


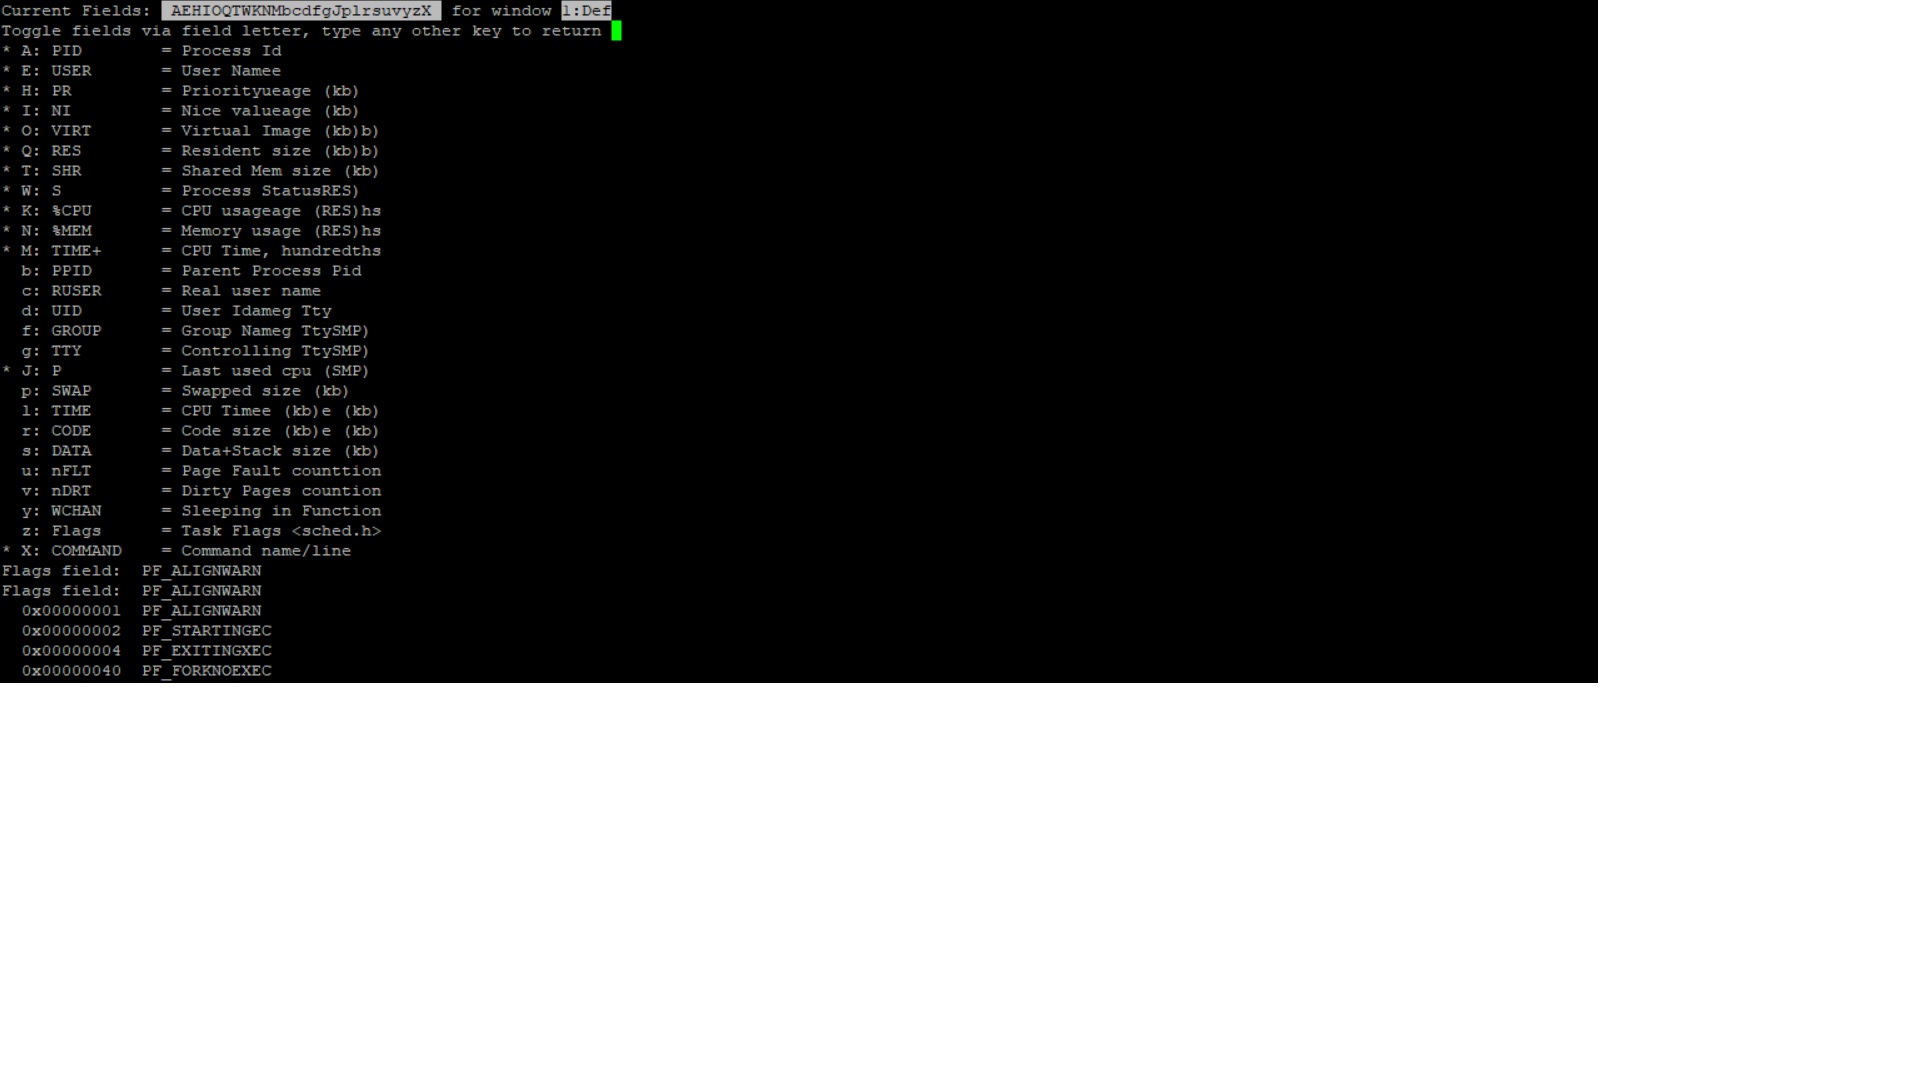
 From the last image we see (P column) that the process uses CPU 7 but after a while it will change to CPU 6 and etc…
 As I understood which PROCESSOR will be used by process considers randomly (might be by using system internal algorithm).
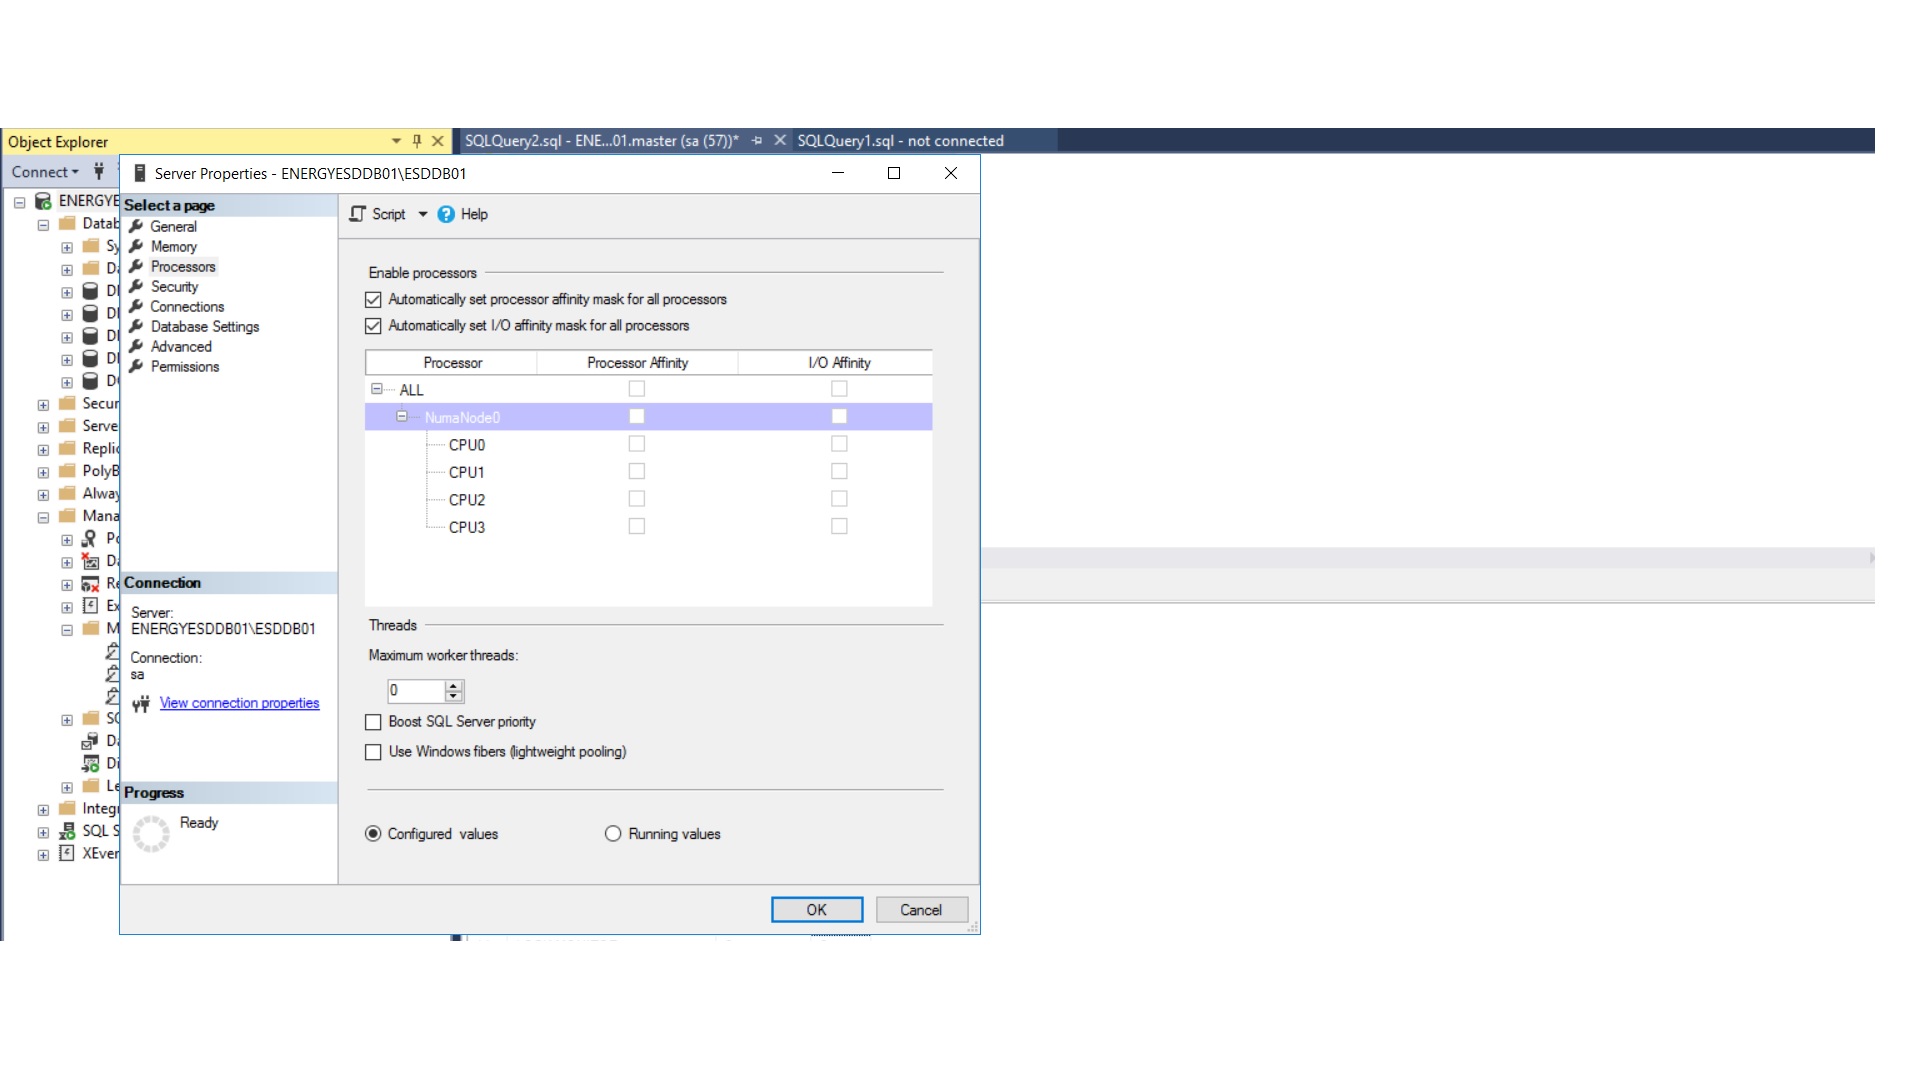
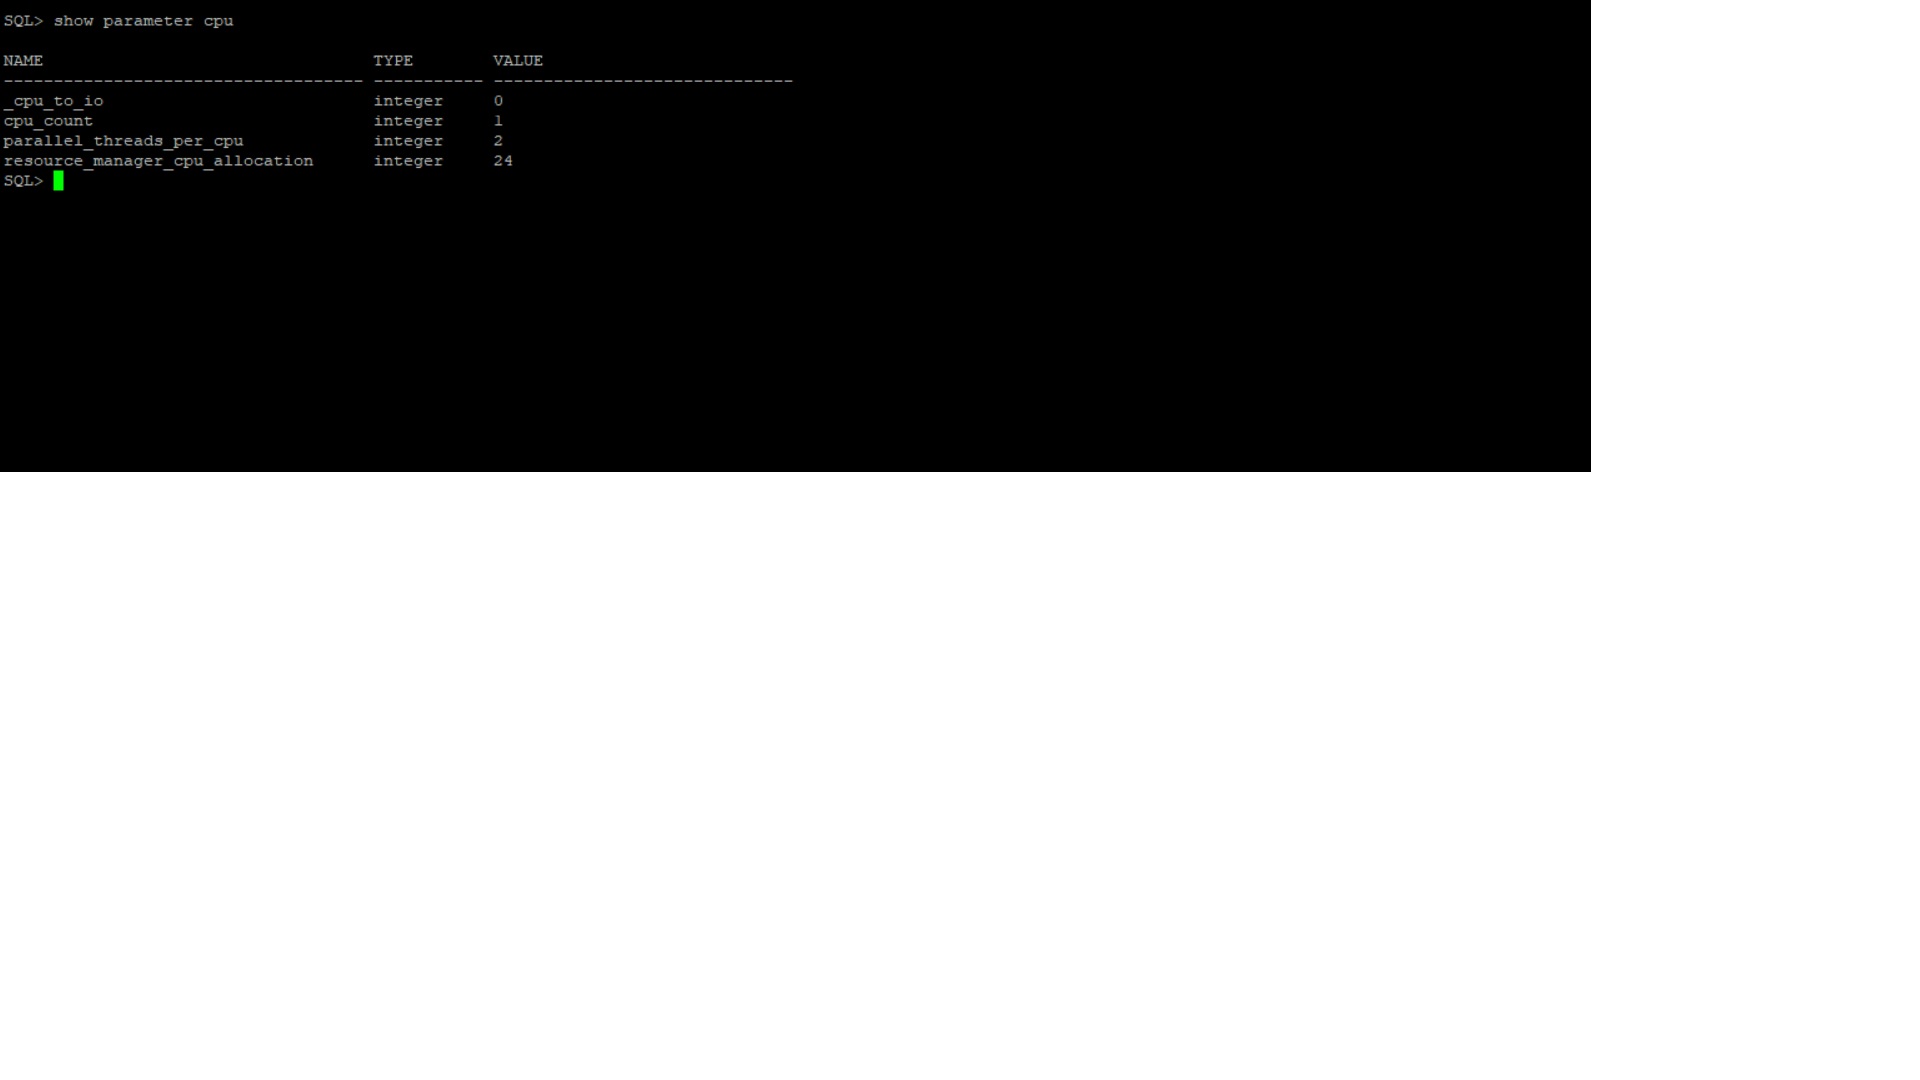
 Conclusion: By setting CPU_COUNT we just set the number of using CPU (as expected) and which CPU will be used by process considers randomly (might be by using system internal algorithm).